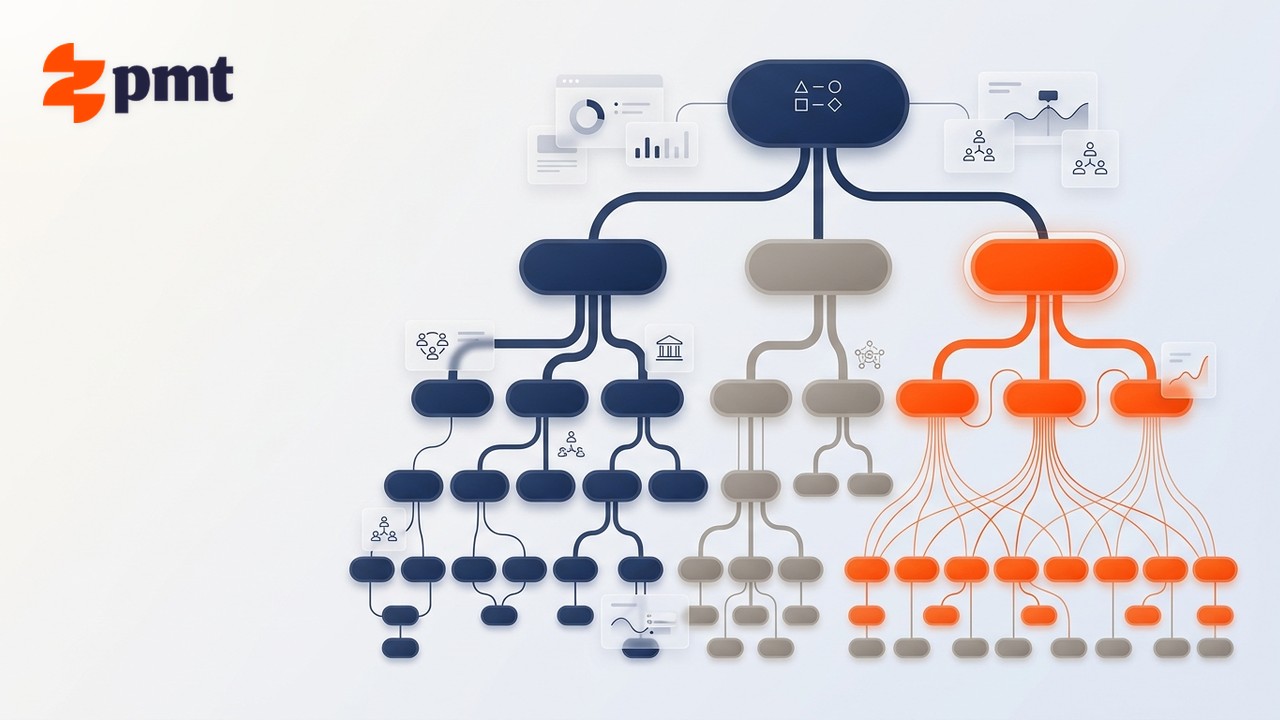
The best way to understand what ZeePMT does is to follow the assistance cycle from end to end: the chain that every facility actually runs, from the moment a partner institution submits a request to the moment a donor receives a traceable report.
Each screen below represents a stage in that chain. This tour shows what each screen decides and what it makes possible at the next stage.
The request list: where the work begins
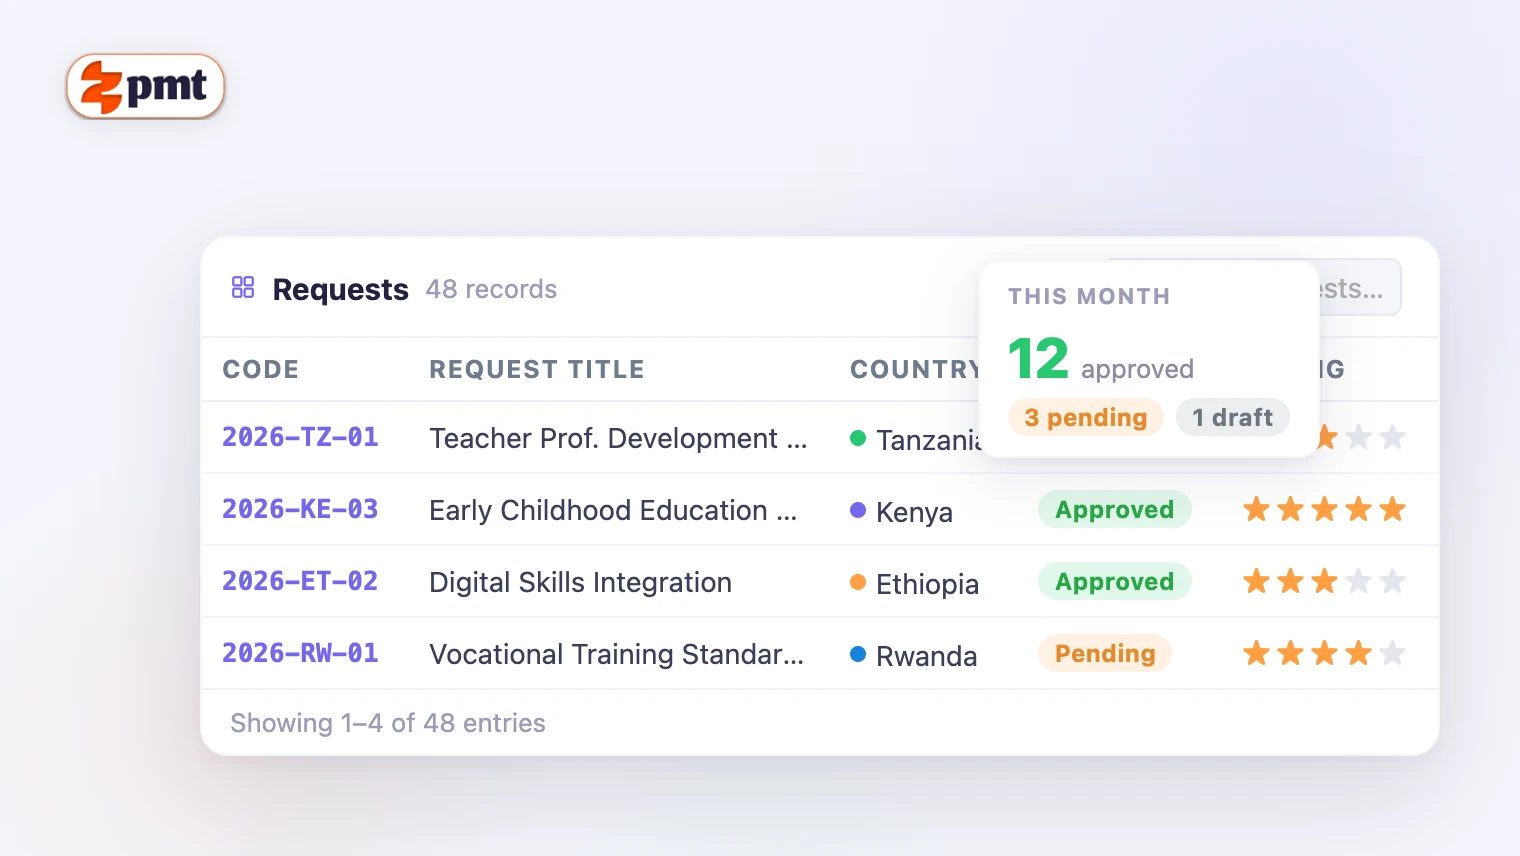
Every TA facility runs on requests. A request is a formal commitment from a partner institution: this is what we need, this is why, this is the scope. Nothing else can happen before a request is received, reviewed and approved: no expert mobilised, no budget line committed, no indicator tracked.
The requests list is the intake point for that work. It shows every open request across the portfolio: its code, title, requesting institution, current status and performance rating. From here the programme team can prioritise, filter by country or status, and open any request to assess it in detail.
The request record: what a single request carries
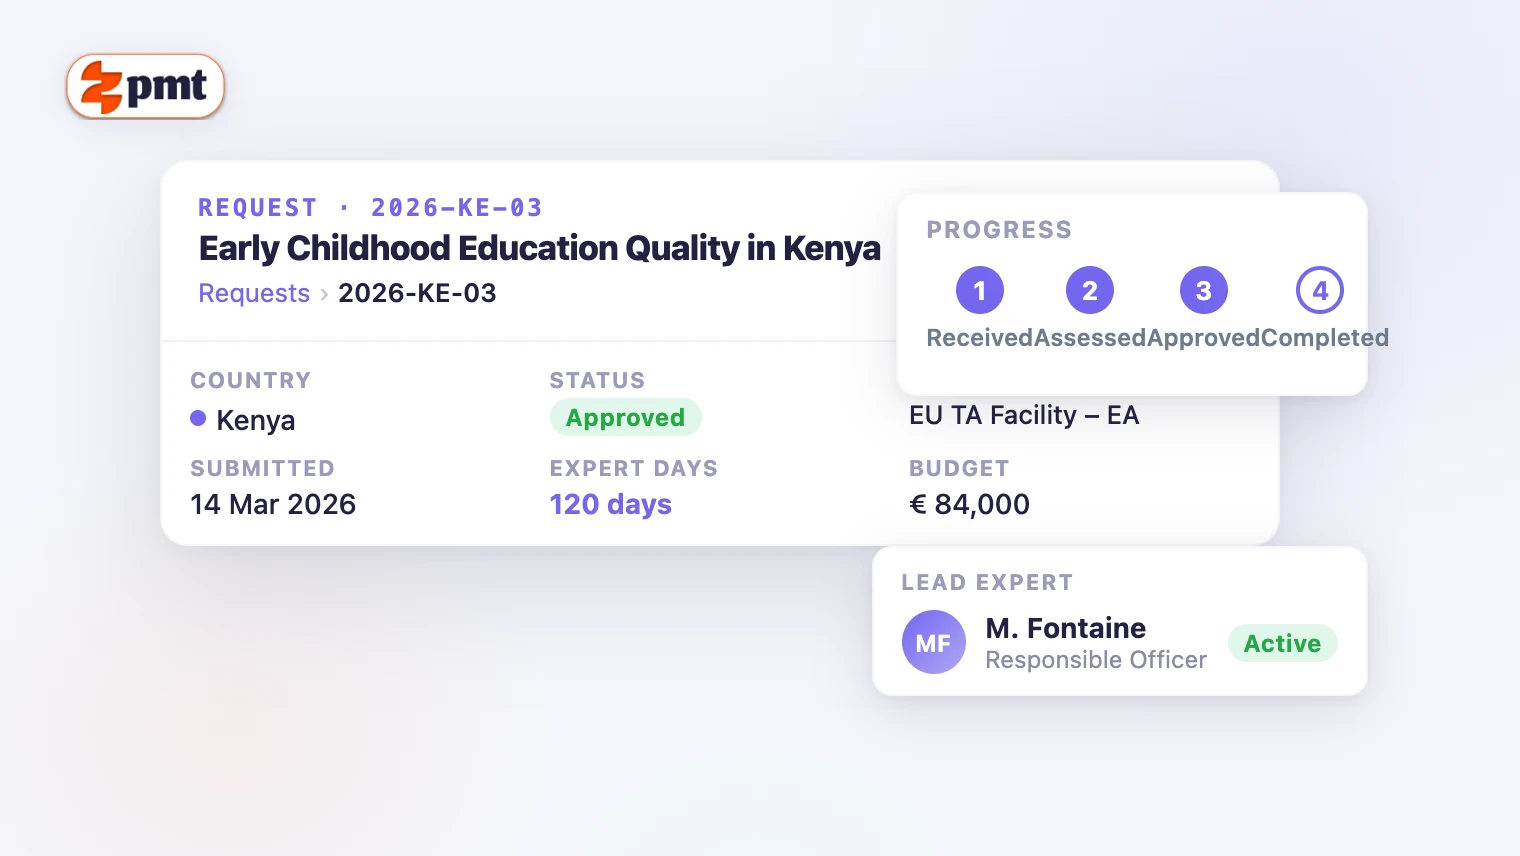
Opening a request shows the operational unit that sits behind the list entry. The record captures the requesting institution, the focal point who submitted it, the sector and geographic scope, the priority and the expected results. It carries a full status history (who reviewed it, who approved it, at what date) and links forward to the action plan it triggered once approved.
The record is the unit of accountability. The institutional question of who committed to what, when, and on whose authority is answered here, not in an email thread.
The programme hierarchy: turning a commitment into a plan
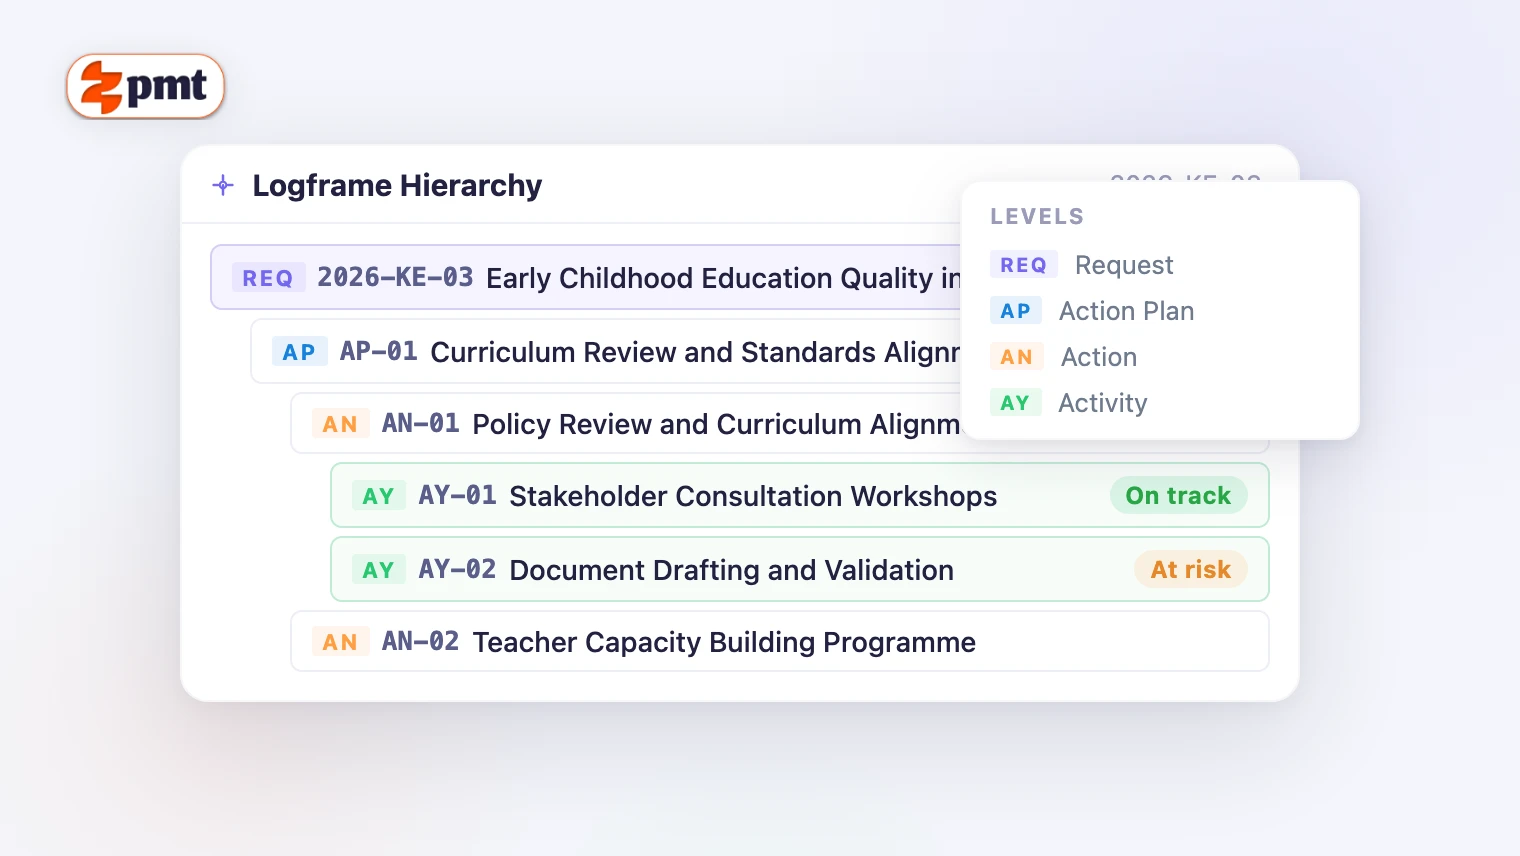
Once a request is approved, it is programmed. That means decomposing the commitment into a structured hierarchy: an action plan broken into work packages, each subdivided into activities. Each level carries its own status, budget allocation, responsible officer and timeline.
The hierarchy view makes the structural relationship between levels explicit and navigable. A programme manager can see, at a glance, how the top-level commitment is distributed across the delivery structure, and whether any activity is running behind schedule or over its budget envelope.
The expert roster: the facility's durable asset
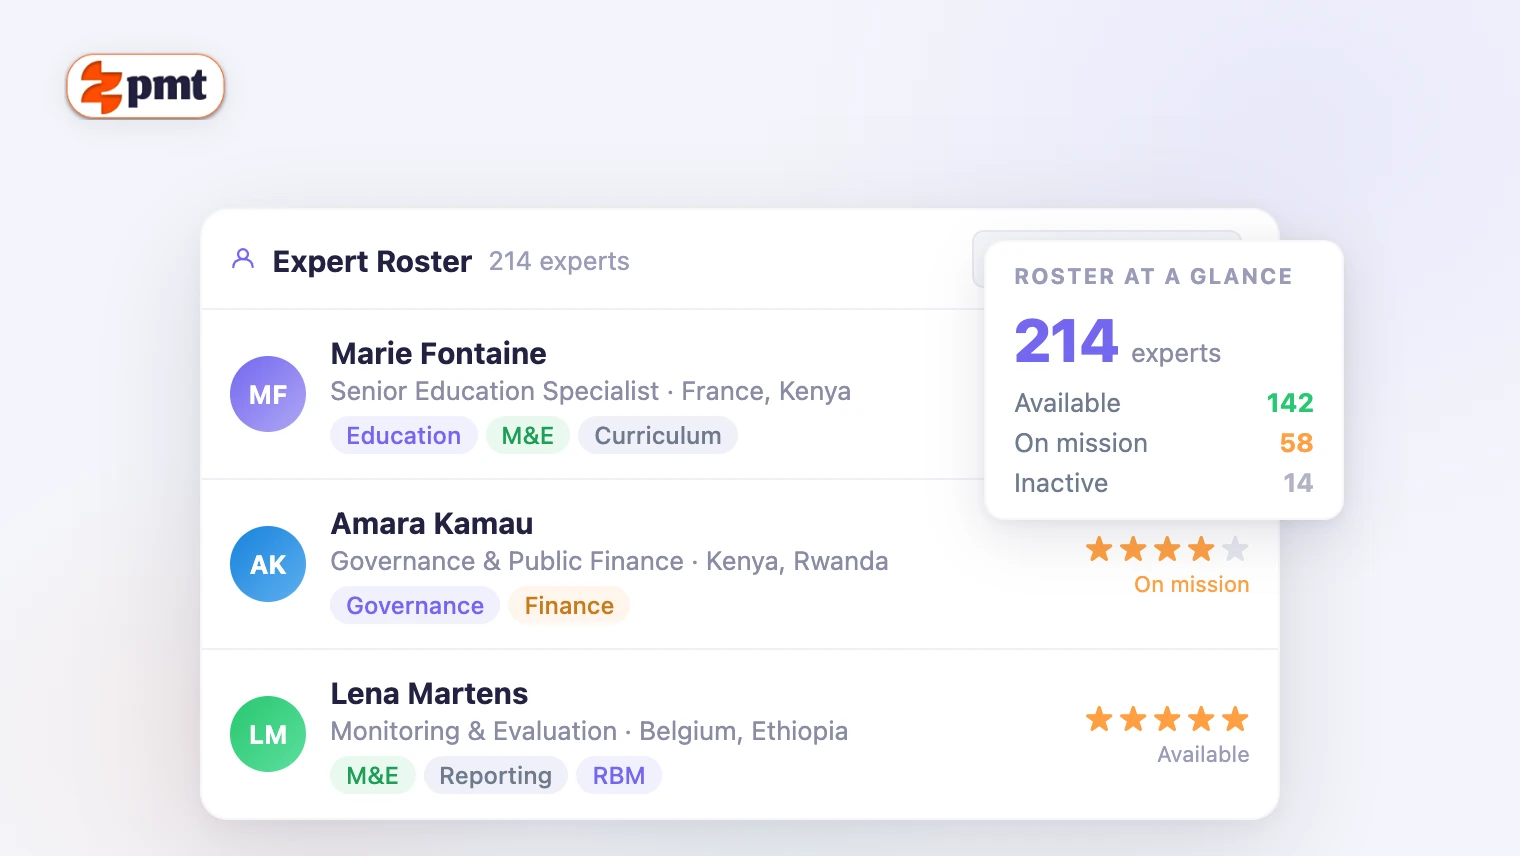
Once an activity is defined, it needs to be staffed. The expert roster is where that search begins. It holds the structured profiles of every expert in the facility's network: professional classification, nationalities, sector tags, geographic experience, assignment history and performance evaluations.
The roster is reusable by design. A profile built for one call is retained and available for every subsequent call. Rather than re-recruiting from scratch each cycle, the programme team searches the existing network, filters by the criteria that matter for the assignment, and opens calls to the relevant subset. Over time, the roster compounds in value: it carries a structured record of who has delivered well before.
Workload and days: the currency of delivery
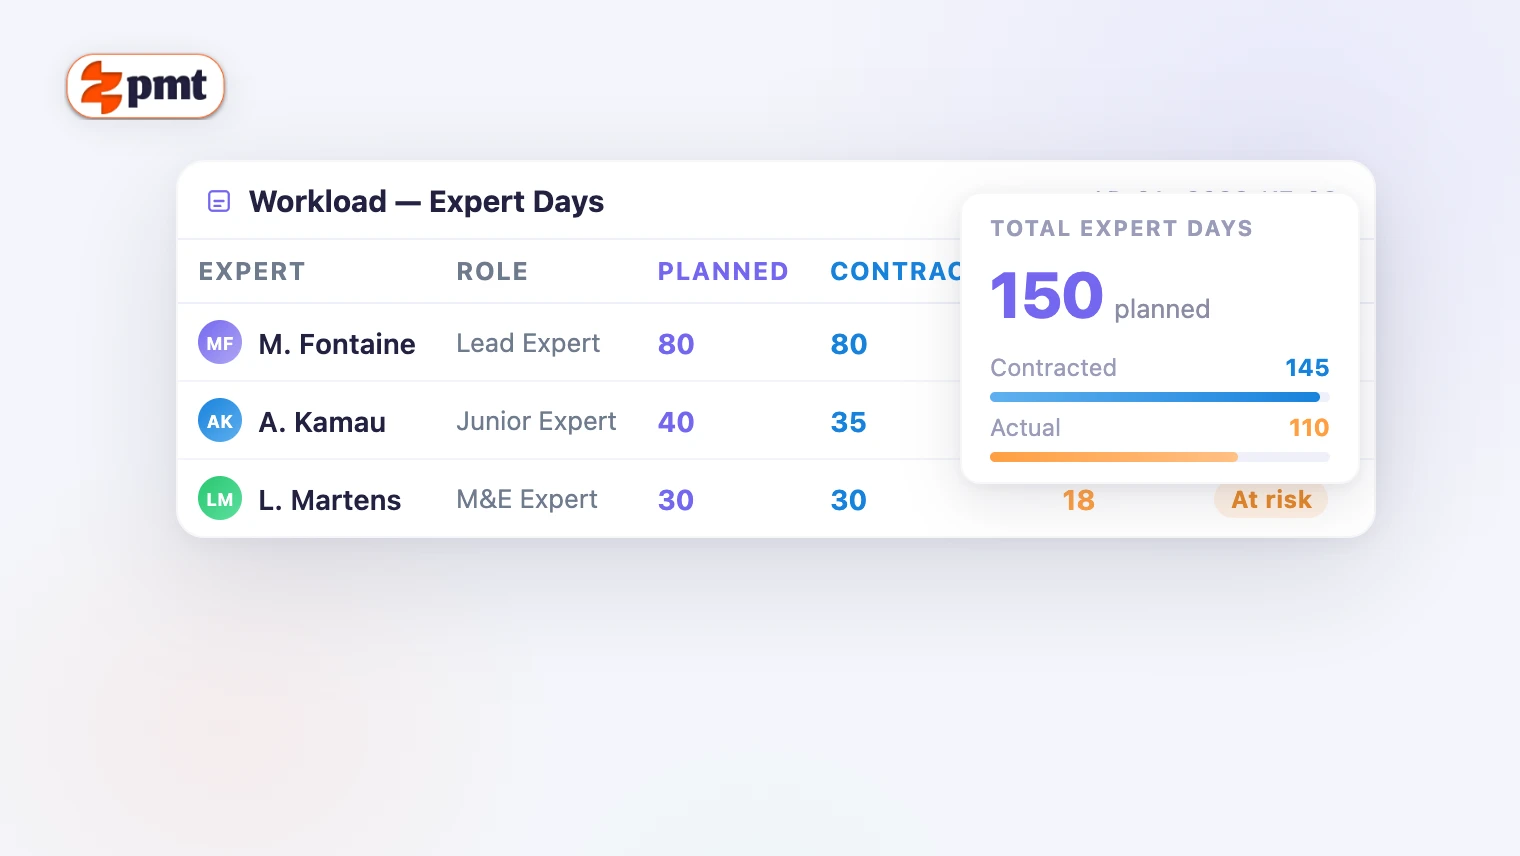
In technical assistance, delivery is measured in days. Working days are the input, the time contracted with an expert. Mission days are the presence, days spent in the field, often carrying additional costs and particular weight in the records of the partner institution.
Three figures matter for every assignment: planned, contracted and actual. The gap between planned and contracted reflects programming quality. The gap between contracted and actual reflects delivery performance. Both have budget implications. Both feed into donor reports. Tracking all three at activity level, connected to the expert and the contract that generated them, turns a day count into an auditable financial record.
Monitoring: the portfolio view at any given moment
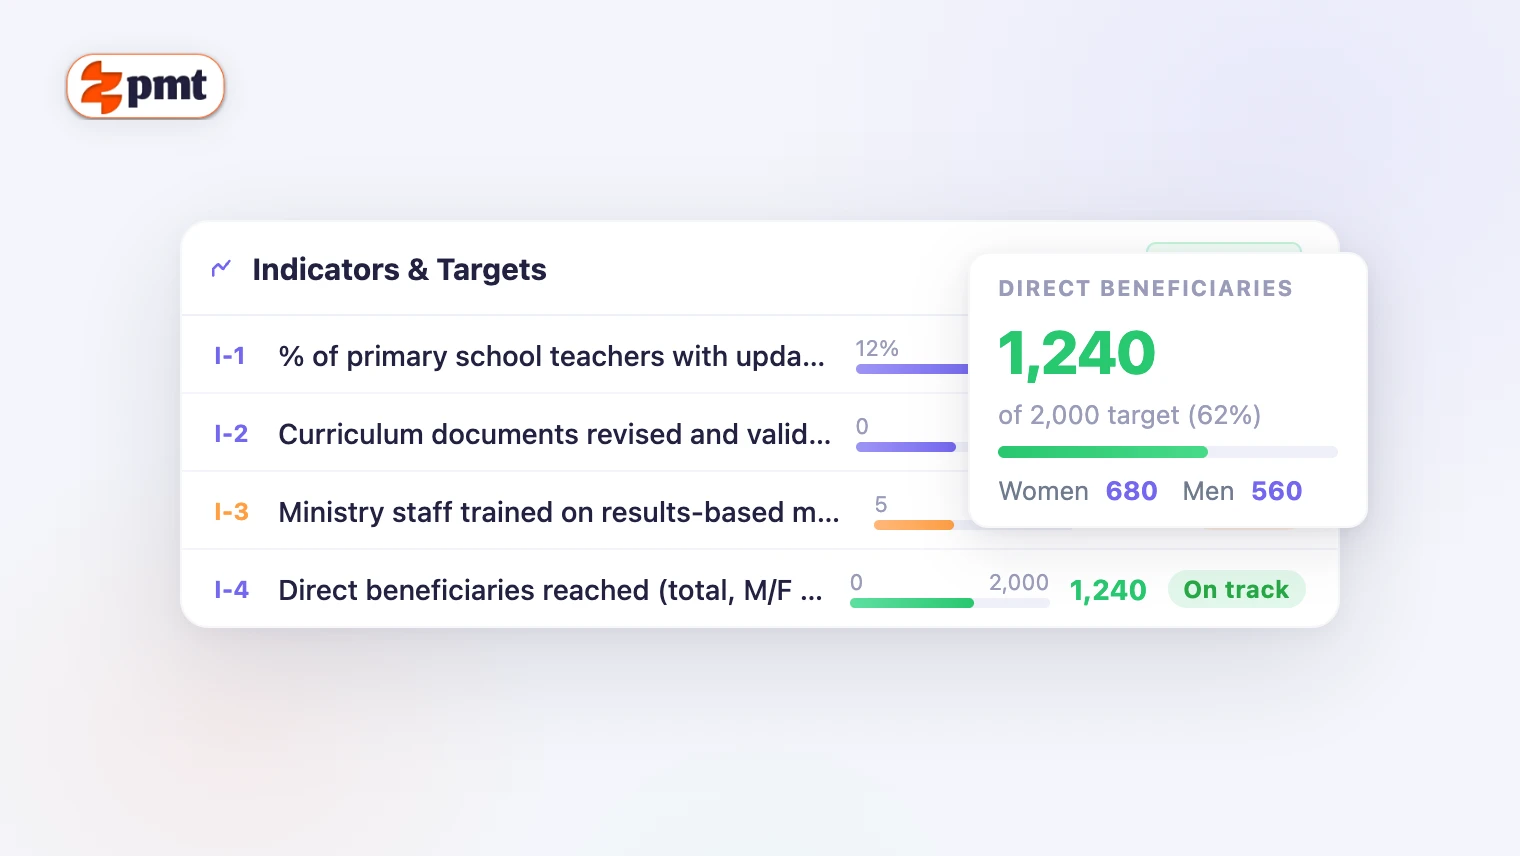
With activities running across countries, work packages and funding sources, the monitoring screen is where the programme team tracks how the portfolio is performing in aggregate. Budget execution, working days delivered, indicator values: all drawn from the activity-level records and aggregated upward by the data structure that connects the levels.
Because the monitoring view reflects the live state of operational data, it shows the programme's current position on any given day, not a snapshot assembled at the end of a reporting cycle.
Reporting: from live data to donor output
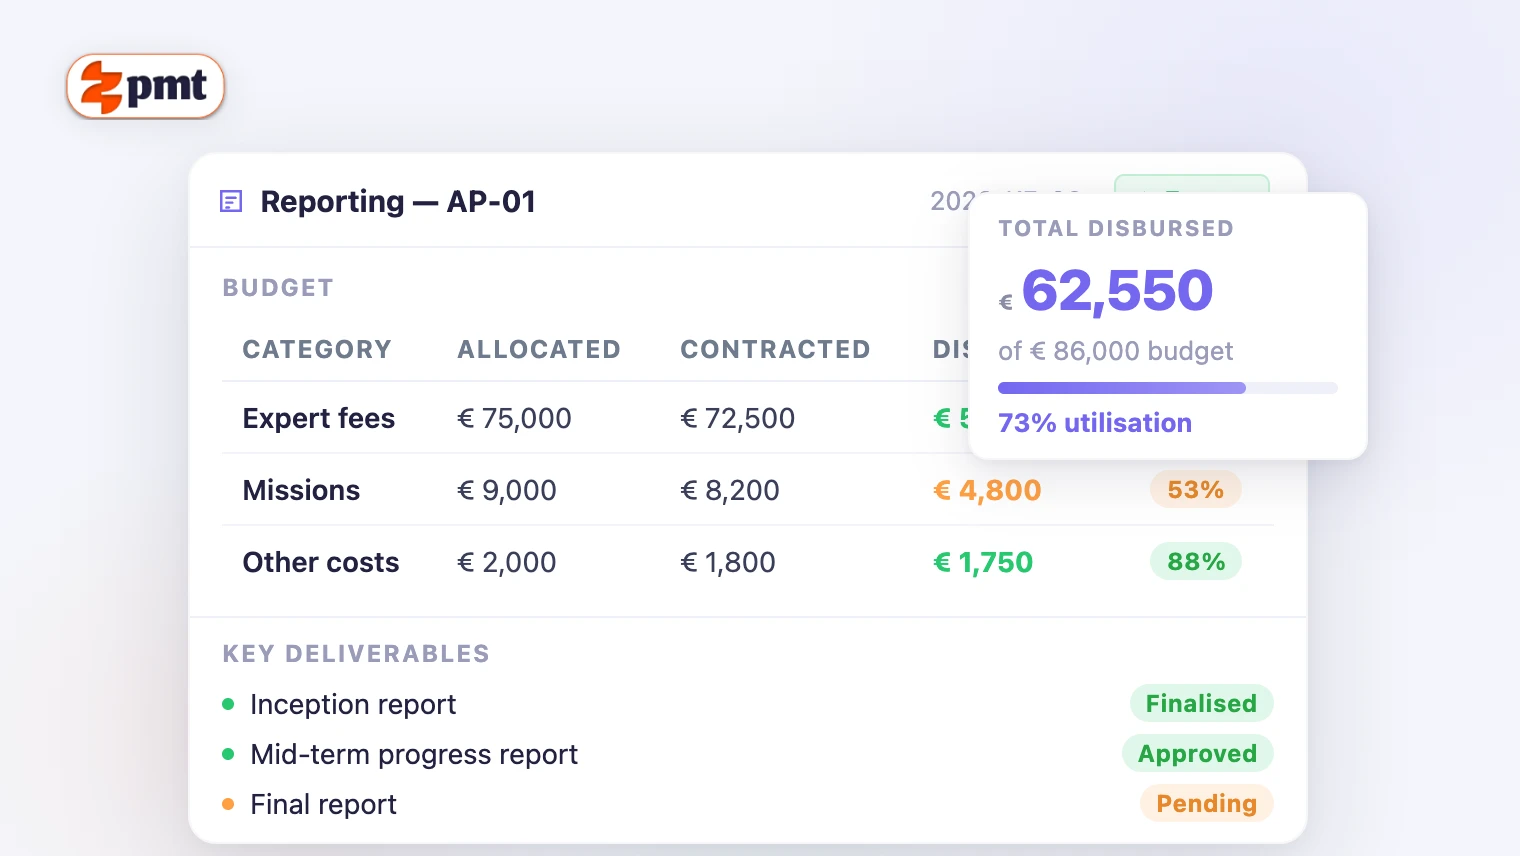
When the data is structured and current, the reporting screen assembles budget execution, expert days and deliverable counts from operational records and presents them in a format ready for export. Reporting is not a separate exercise; it is a view of what the system already knows.
Every figure is traceable to its source. When a donor asks where a number came from, the answer is in the data structure. That traceability follows from the data being connected correctly in the first place.
Governance: the audit trail that never needs assembling
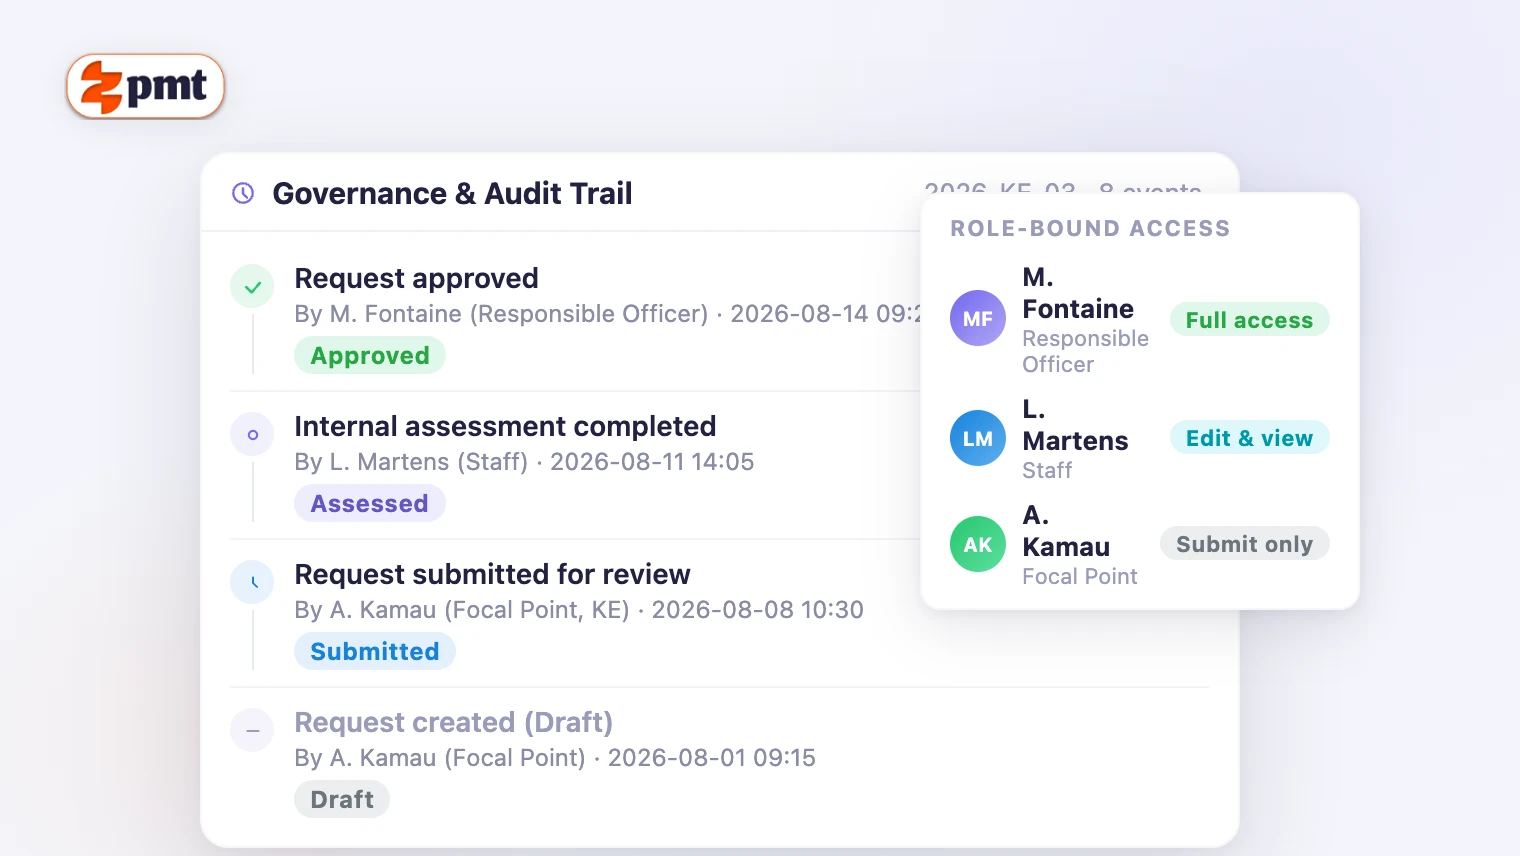
At every stage of the cycle, every action has an owner, a date and a permanent record. The governance screen makes that record navigable: a structured decision log showing what was done, by whom and when, alongside a role-bound access panel that shows who holds what permissions on each record.
This is the operational record, made queryable. When an auditor or a funder asks who approved this request, who validated this contract, or who accessed this expert's personal data, the answer is already in the system, produced as output rather than assembled from emails under pressure.
The bottom line
The tour above follows a single chain: request → action plan → activities → experts → working days → monitoring → reporting → audit trail. Each screen is a stage in that chain, and each is useful because of how it connects to the stages around it.
The data you enter to run the programme is the same data that produces the reports, populates the audit trail, and builds the expert roster for the next cycle. Nothing needs to be entered twice or reconciled at reporting time. A platform built around the assistance cycle makes that possible; a collection of unlinked tools does not.